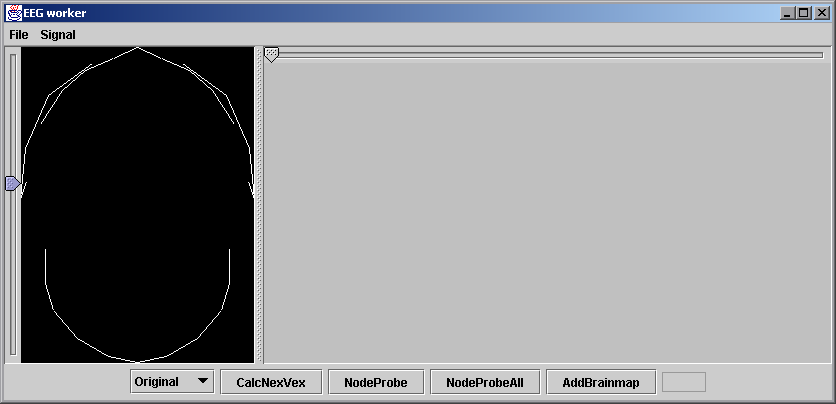
Initially the program displays a blank.
When you unzip the package you should find three directories inside the jeeg directory: classes, data and src. The source code is in src. The java compiled code is in classes. If you are using windows, you will find two batch files that are useful: b.bat and r.bat. Executing the first will to compile the code (this won't be necessary unless you have changed it), and the executing second will run the program. It contains the line:
java -cp classes EEG data/vp17.E1.app3.3 0
The first parameter after "EEG" is the name of the data file (output from the ECI device). The number 0 means we will load the first experiment (or trial) from this file. Most files contain over 50 experiments, but to save memory, this example contains only three.
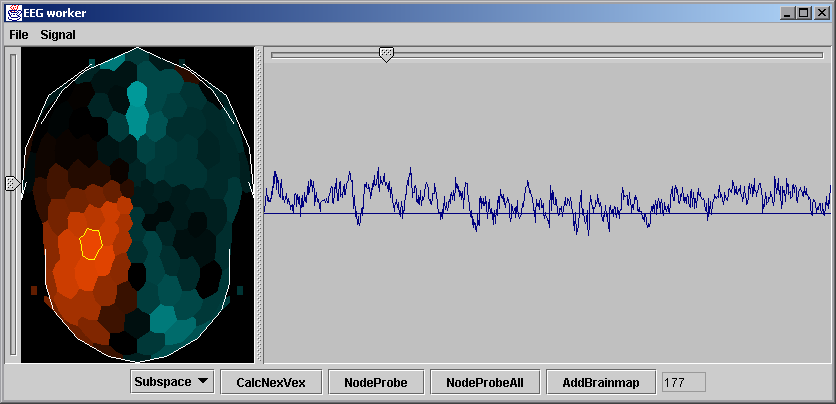
If the program starts up you should get a window looking like this:
|
The slider along the top represents the time samples from the EEG (there are 850 in this example, recorded at 500Hz, and so represents about 1.7 seconds of brain activity). The number in the rectangle to the right of the button labelled AddBrainMap is the current position of the time slider.
The dark panel on the left of the window is a visual display of the intensities at the 129 probes (the surface area of the skull has been flattened with the nose at the top and the ears on the side for easy viewing), blue for a negative signal and red for a positive signal. The vertical slider on the left of it controls the brightness of the display. (TG adds that while 128 probes are standard, the 129th is the negative sum of the values so that the over-all sum is zero.)
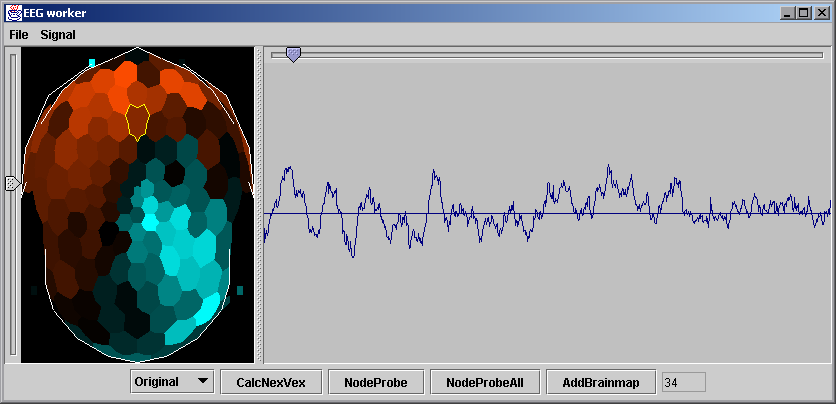
If you click the mouse on one of the hexagons in the electrode display, the right hand side of the window will display its EEG trace through time. Your window should look like this:
 |
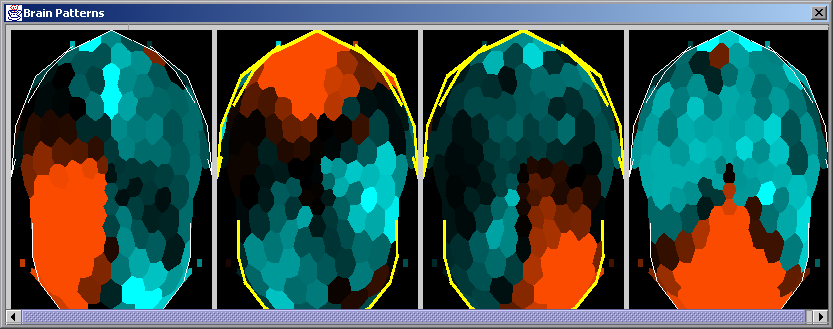
Now press the button marked CalcNextVex seven times. A second window will appear showing seven separate displays of the brain activity at seven points in time along the 850 time samples:
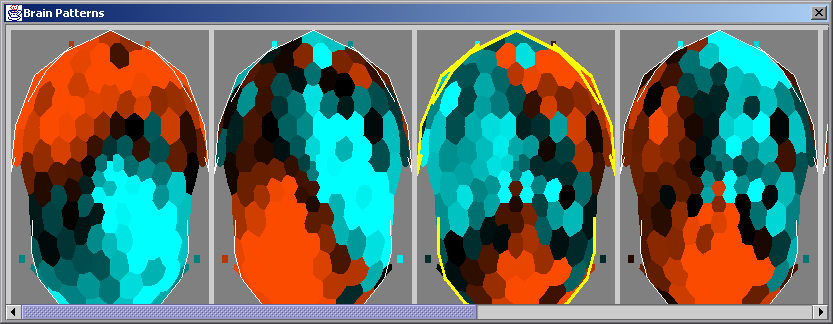 |
If you click on the first picture in the new window, it will be highlighted with a yellow outline. You can select more than one by holding down the control key while you mouse click on others. You can deselect the yellow-outlined electrode polygon on the left hand side of the main window by holding down the control key and clicking in that with the left mouse button. [Instructing people how to get through a user interface by using just the written word is quite tediuous even for simple operations like this.] Your display should look like this if you don't have too many signals super-imposed on top of one another:
 |
The drop-down panel to the left of the buttons marked Original contains the alternative settings Subspace and Error. You can change the display on the left to show one of these other settings. They represent the space spanned by the seven brain pattens shown in the second window, and the remaining error respectively. You can move the top slider along in time to see how they interact.
To make what is happening easier to see, select File | ResetSelVex from the menu-bar on the top left of the window to clear the brain patterns window. Now press the CalcNextVex only once to get a single brain pattern. Select Subspace on the bottom left hand drop-down panel and now slide the top slider along in time. You should that single brain pattern change in intensity as you slide the pointer along. The program has done some linear algebra calculations to work out the best value to match the data. (At the point where it matches the time the pattern was taken from, you get a perfect match by taking the intensity to be 1. That is why there is a peak at that point in the time trace to match the vertical purple line.)
There is only so much you can do to match the variation with a single vector or brain pattern. If you select Error on the bottom left hand drop-down panel you will find most of the original patterns still there, because that is what is not accounted for.
Press the CalcNextVex button a second time, select the Subspace view, drag the timer slider along and note how you can see the effective sum of two patterns in the changing view. More than this and it gets hard to see. At each stage, the Error view gets blacker and blacker as it tends closer to zero. As I suggested, about seven vectors or brain patterns account for most of the variation in this data.
There's more.
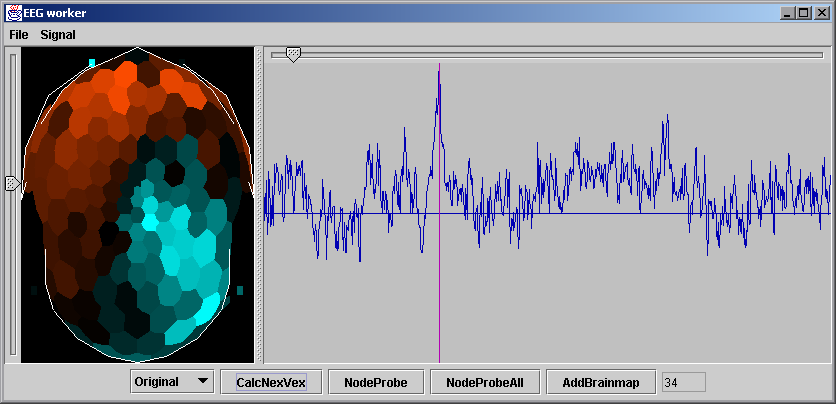
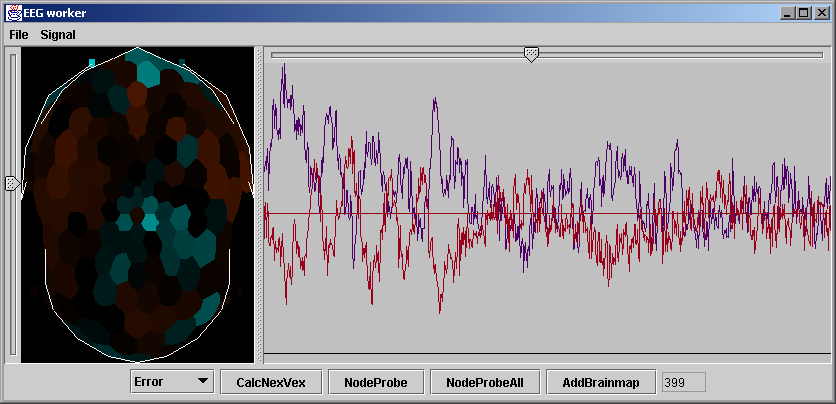
After you have got enough brain patterns loaded into the second window to account for the variation, you should select a node in the left hand panel as shown below and click on the button NodeProbe. What this does is combine the seven (or more) brain patterns to create the best pattern it can surrounding your selected node. In theory, if you pick the right place you should be able to extract a pure dipole generator from the pattern. Pure as in it represents a signal that only comes on all at the same time.
Try this button after selecting different nodes. Sometimes you don't get a very good signal, and sometimes you do get a strong pattern. They tend to cluster towards distinct patterns which, in a sense, could be the original generators in the brain before they were all summed up to produce the measured data.
 |
To help you, the NodeProbeAll button applies this to each and every node in the picture and colours it according to how good a signal you are going to get from doing the NodeProbe. This saves you having to hunt around too much.
Finally, if you have node-probed a good signal, as I have done above, you can click on the AddBrainMap button and commit it to the Brain Patterns window. It will erase all the other brain patterns (which have grey backgrounds) and replace it with a copy of this one with a black background.
 |
You now have to repeat the procedure to find a different brain pattern to add. Click on CalcNextVex several times, then try NodeProbeAll followed by selecting a different good looking node and clicking on NodeProbe to get a different pattern and then do AddBrainMap again.
On this particular data I can find the following four generators, two of which produce the signal in the trace below:
 |
 |
That's the theory, much of which may be questionable, but it is as far as simple linear algebra can take it. Go back and visit the next page to run the same procedure over some fake data.